Last updated on August 12th 2016.
7. Data Inspection
Once waveform and station metadata has been downloaded (either with the built-in helpers or manually) and placed in the correct folders, LASIF can start to work with it.
Note
LASIF essentially needs three ingredients to be able to interpret waveform data:
- The actual waveforms
- The location of the recording seismometer
- The instrument response for each channel at the time of data recording
Some possibilities exist to specify these:
- MiniSEED and StationXML (strongloy preferred)
- SAC data and RESP files (needed for legacy reasons)
- MiniSEED and RESP files (this combination does not actually contain location information but LASIF launches some web requests to get just the locations and stores them in a cache database)
- Most other combinations should also work but have not been tested.
At this point, LASIF is able to match available station and waveform information. Only stations where the three aforementioned ingredients are available will be considered to be stations that are good to be worked with by LASIF. Others will be ignored.
To get an overview, of what data is actually available for any given event, just execute:
$ lasif event_info -v GCMT_event_NORTHERN_ITALY_Mag_4.9_2000-8-21-17

Earthquake with 4.9 Mwc at NORTHERN ITALY
    Latitude: 44.870, Longitude: 8.480, Depth: 15.0 km
    2000-08-21T17:14:31.100000Z UTC

Station and waveform information available at 51 stations:

===========================================================================
         id       latitude      longitude elevation_in_m    local depth
===========================================================================
    LA.AA00  44.4567283802  5.62467939102            0.0            0.0
    LA.AA01   42.192951649  23.3492243512            0.0            0.0
    LA.AA02  53.2426492521  16.0639363825            0.0            0.0
    LA.AA03  34.5585730668   9.5857134452            0.0            0.0
    LA.AA04  45.6821185764  15.1965770125            0.0            0.0
    LA.AA05  50.2345625685  9.03513474669            0.0            0.0
    ...
Note
The local depth is allowed to not be set. In that case it will be assumed to be zero. For all practical purposes the local depth does not matter for continental scale inversions.
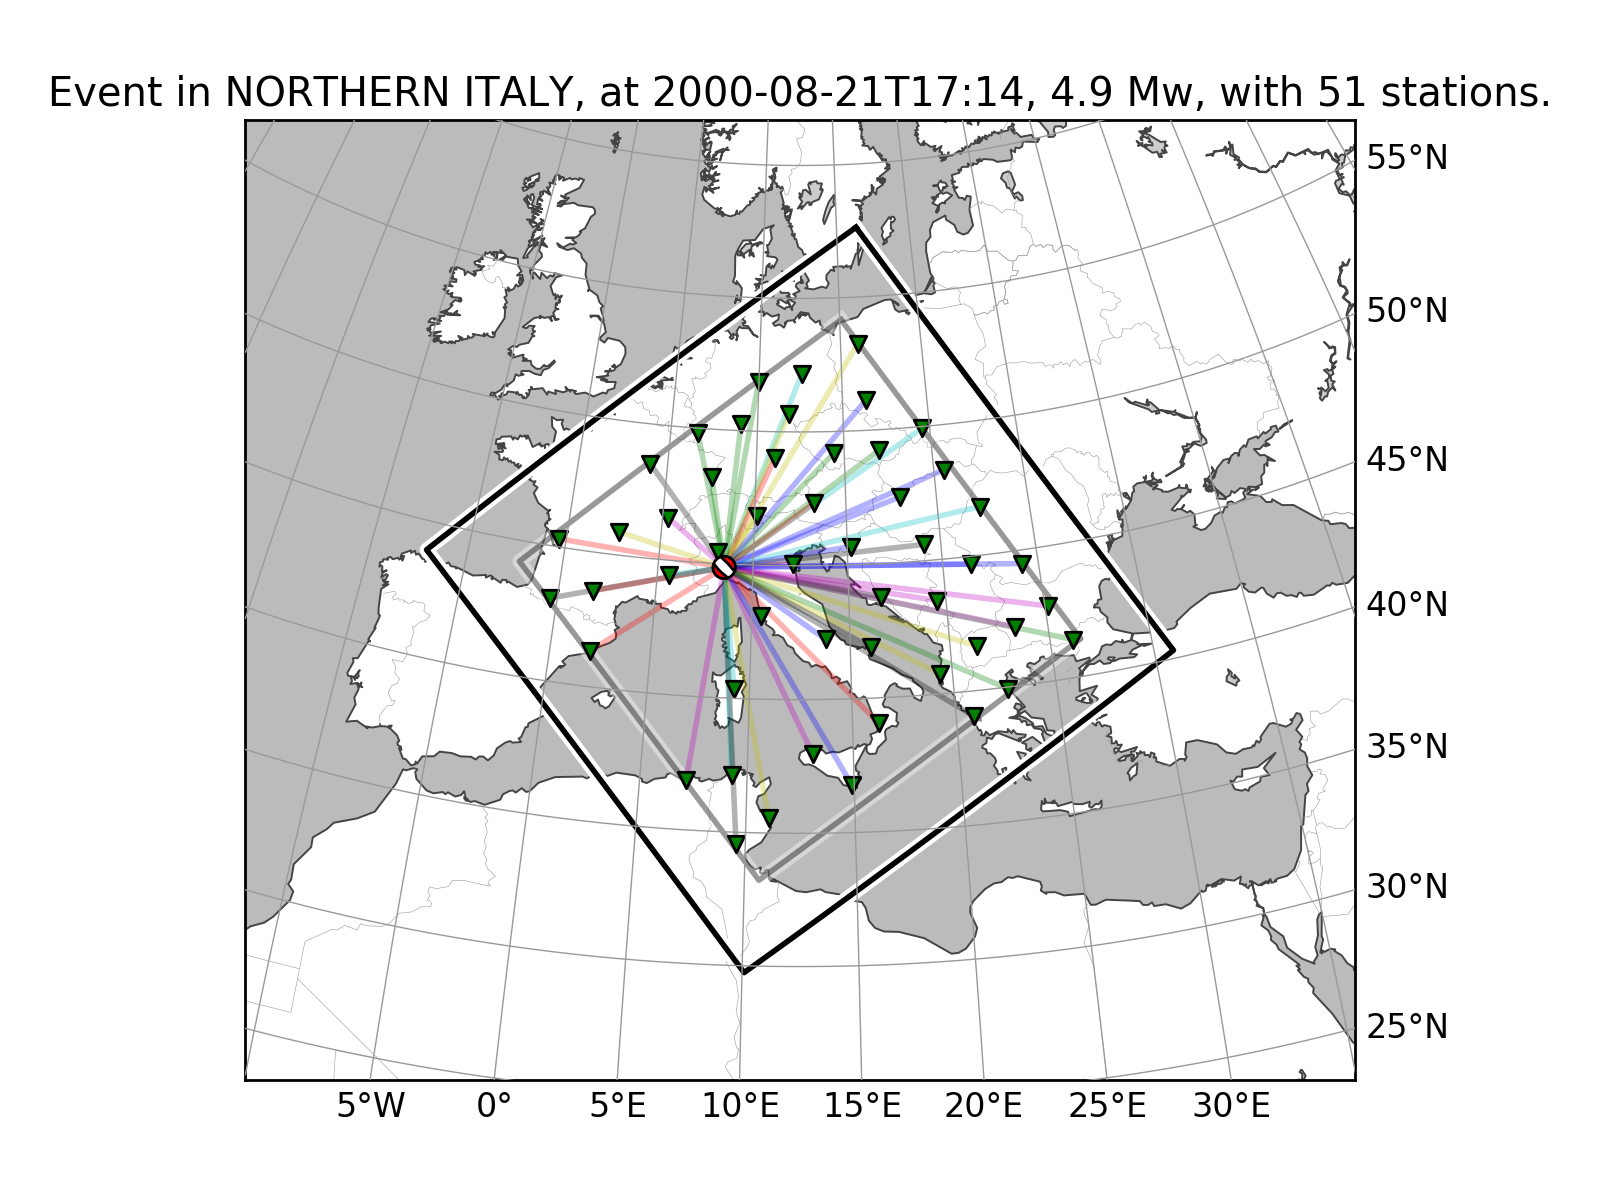
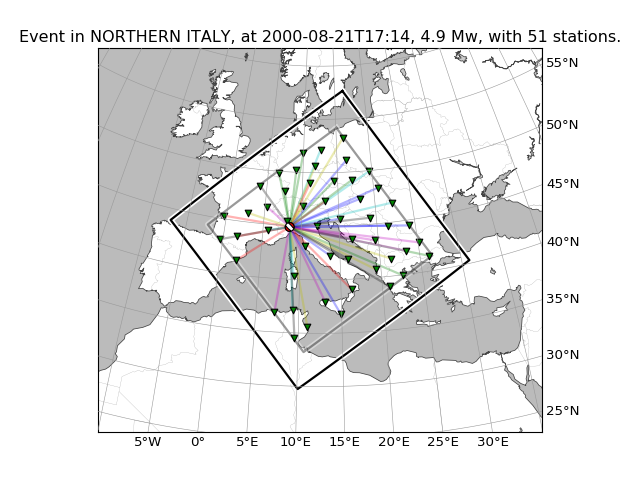
It is furthermore possible to plot the availability information for one event including a very simple ray coverage plot with:
$ lasif plot_event GCMT_event_NORTHERN_ITALY_Mag_4.9_2000-8-21-17
(Source code, png, hires.png, pdf)
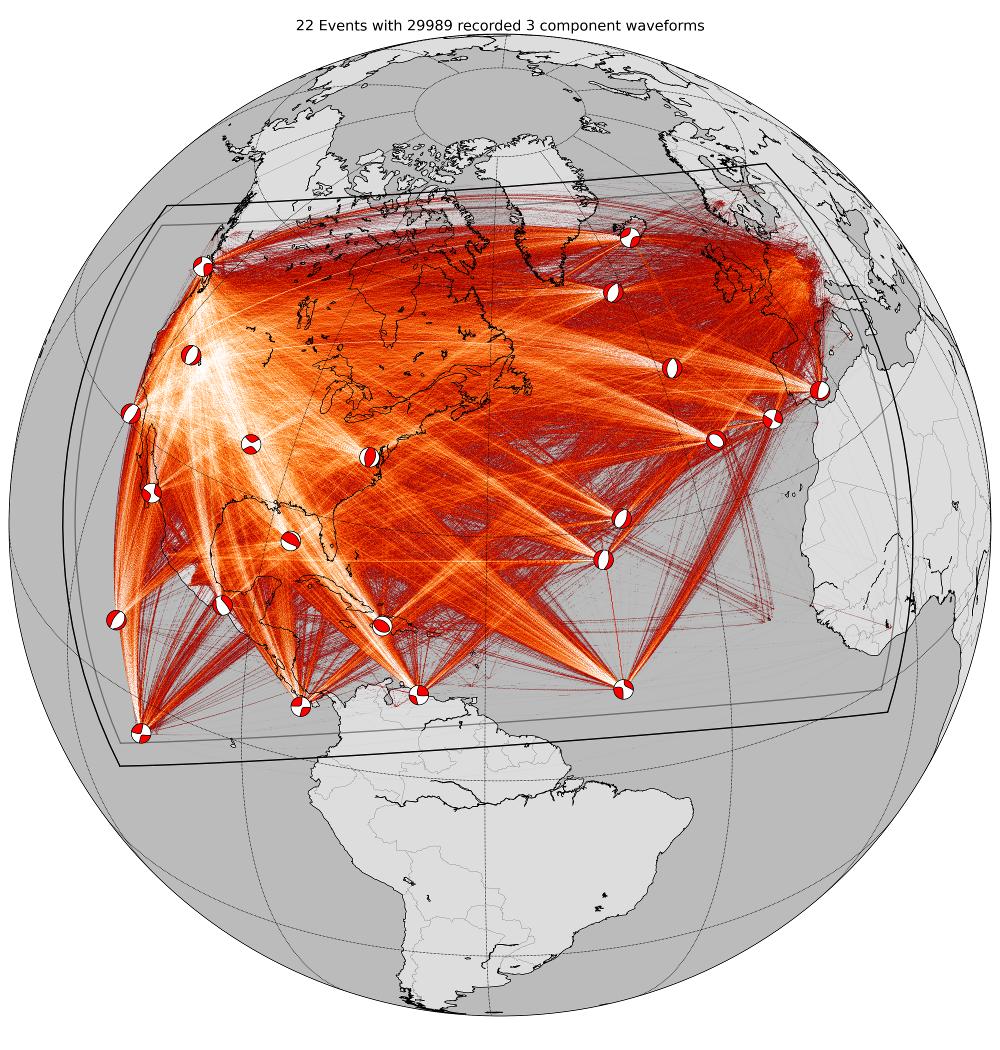
If you are interested in getting a coverage plot of all events and data
available for the current project, please execute the plot_raydensity
command:
$ lasif plot_raydensity
Actually plotting this may take a fair while, depending on the amount of data you have. Keep in mind that this only results in a reasonable plot for large amounts of data; for the toy example used in the tutorial it will not work. It is not a physically accurate plot but helps in judging data coverage and directionality effects. An example from a larger LASIF project illustrates this: