Web Interface
The web interface is a way to interactively explore a LASIF project and the data within. To start it, simply execute the following command inside the folder structure of a LASIF project:
$ lasif serve
This will start a local web server and open the website in your browser. It heavily relies on JavaScript so make sure it is not disabled. Please also use a modern and up-to-date browser. I tested it with Firefox, Chrome, and Safari; Firefox being the slowest of the bunch.
The webinterface is designed to display the state of a project at the time
the serve command is executed. If you modify the state of a project
while the web server is running, the result is undefined. Please restart the
server in that case.
Here are a couple of screenshots highlighting some features of the web interface. Click on them for full size.
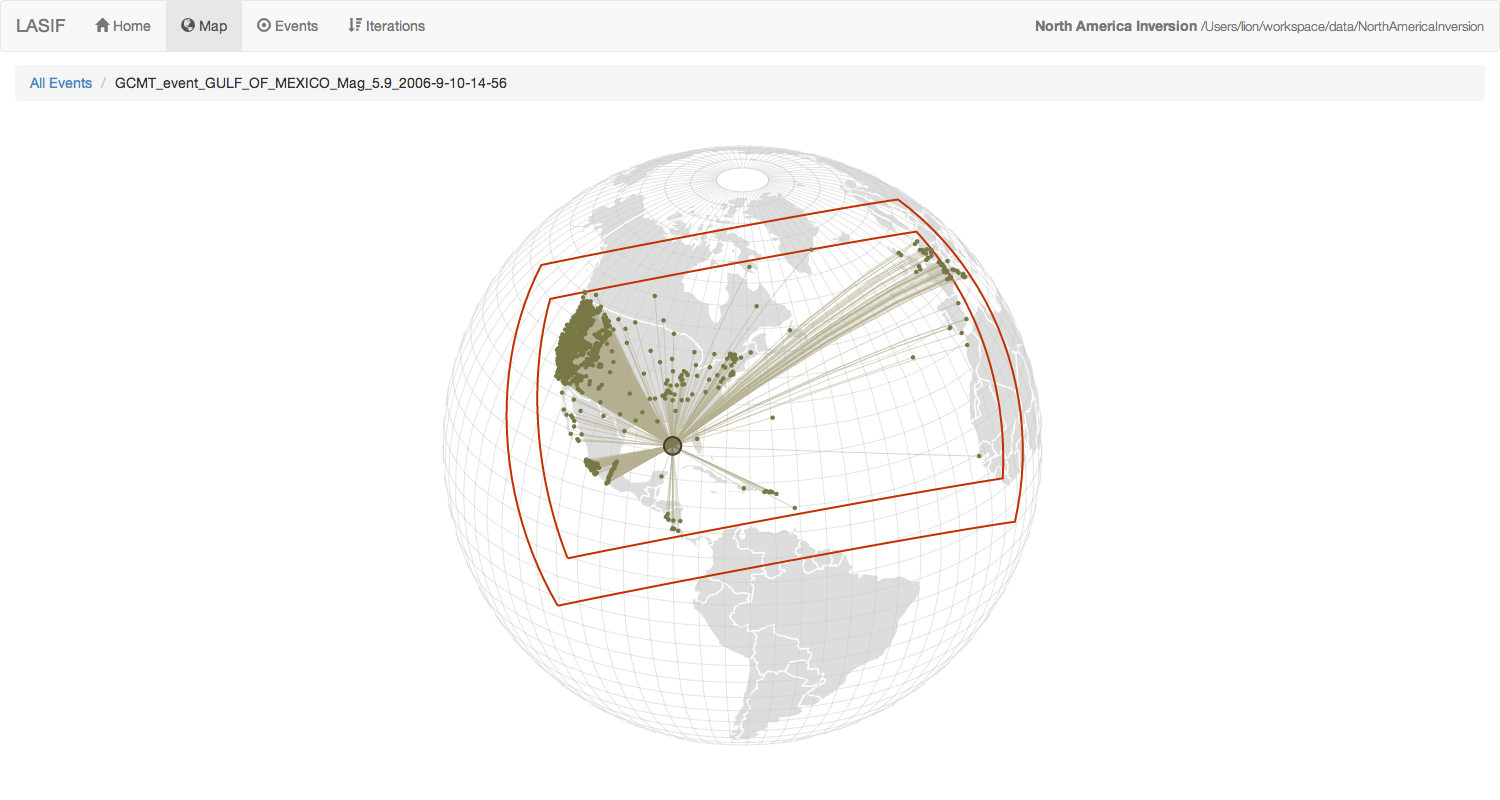
Interactive map capable of showing the domain boundaries, events, and per-event recording stations including raypaths.
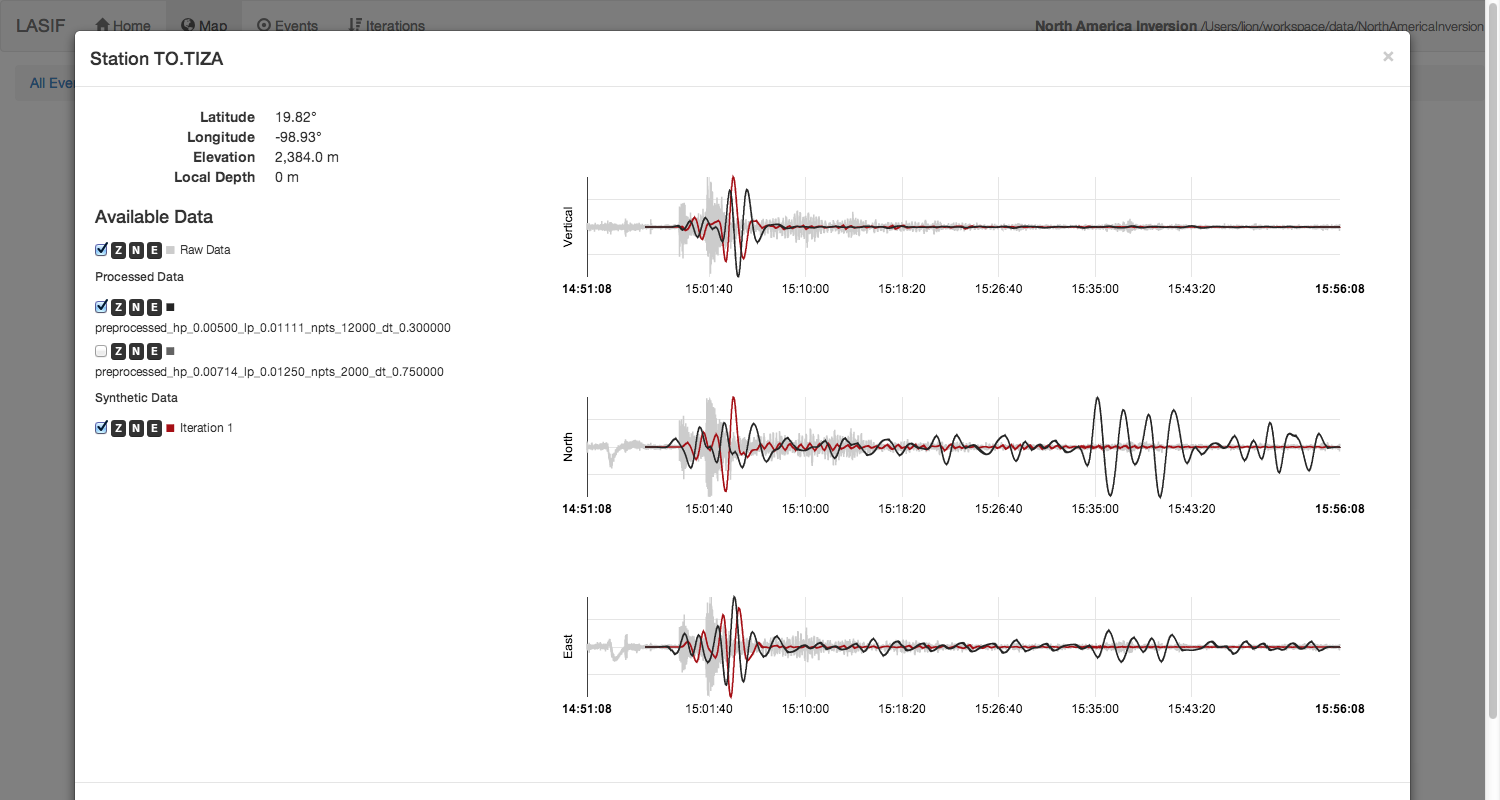
Interactive waveform plotting.
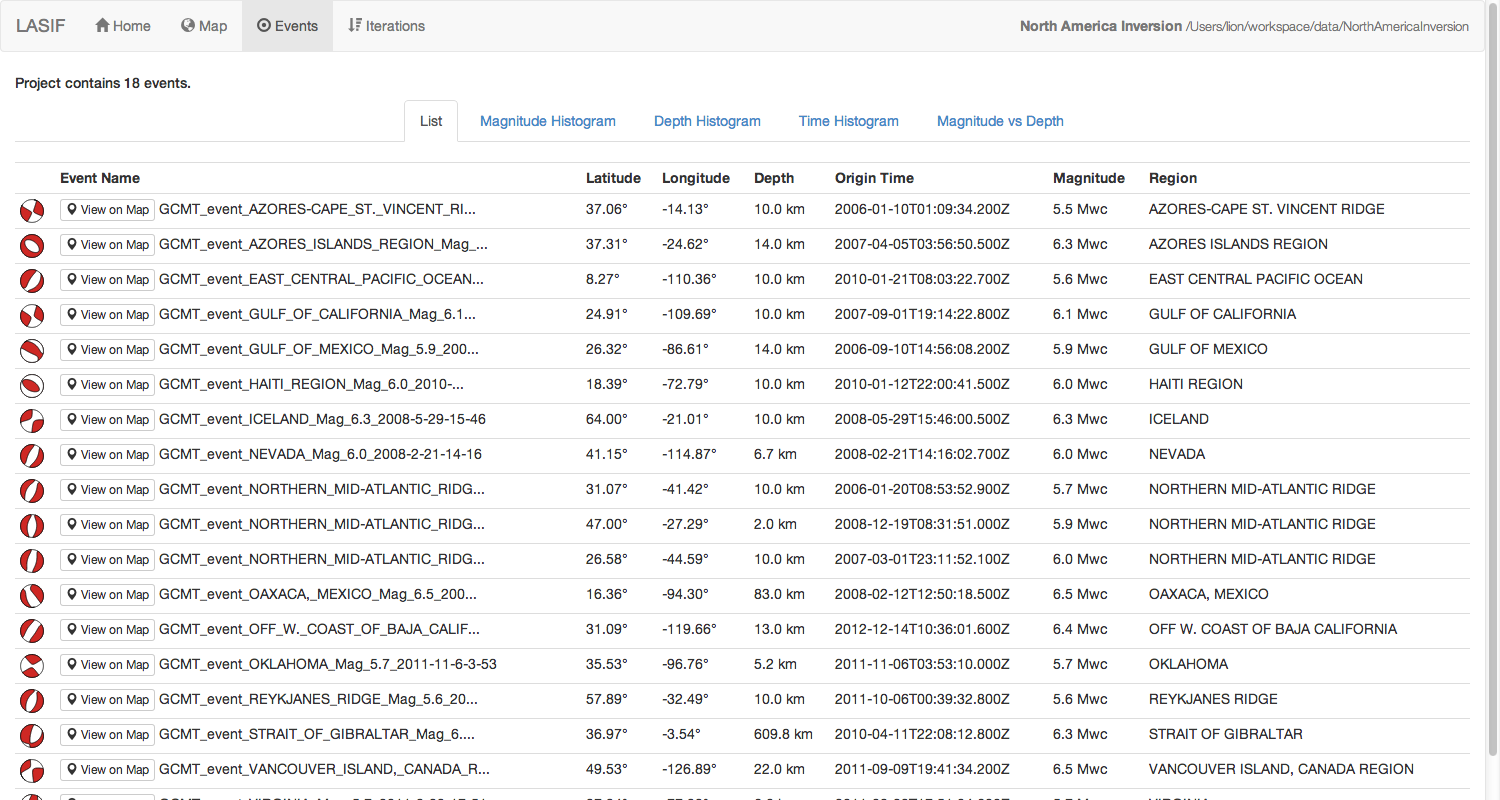
List of all events with some more information.
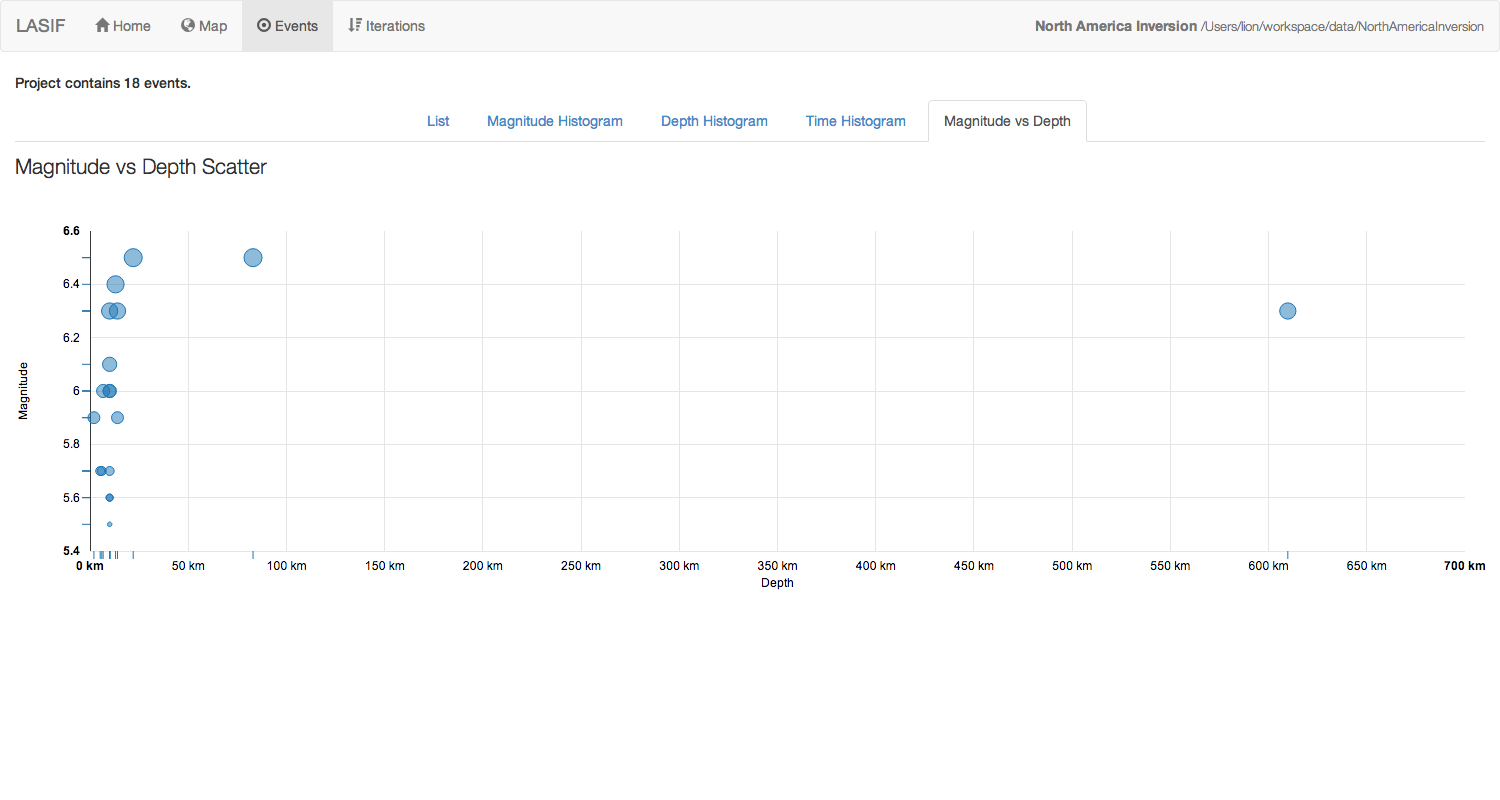
Various interactive plots related to event distributions.
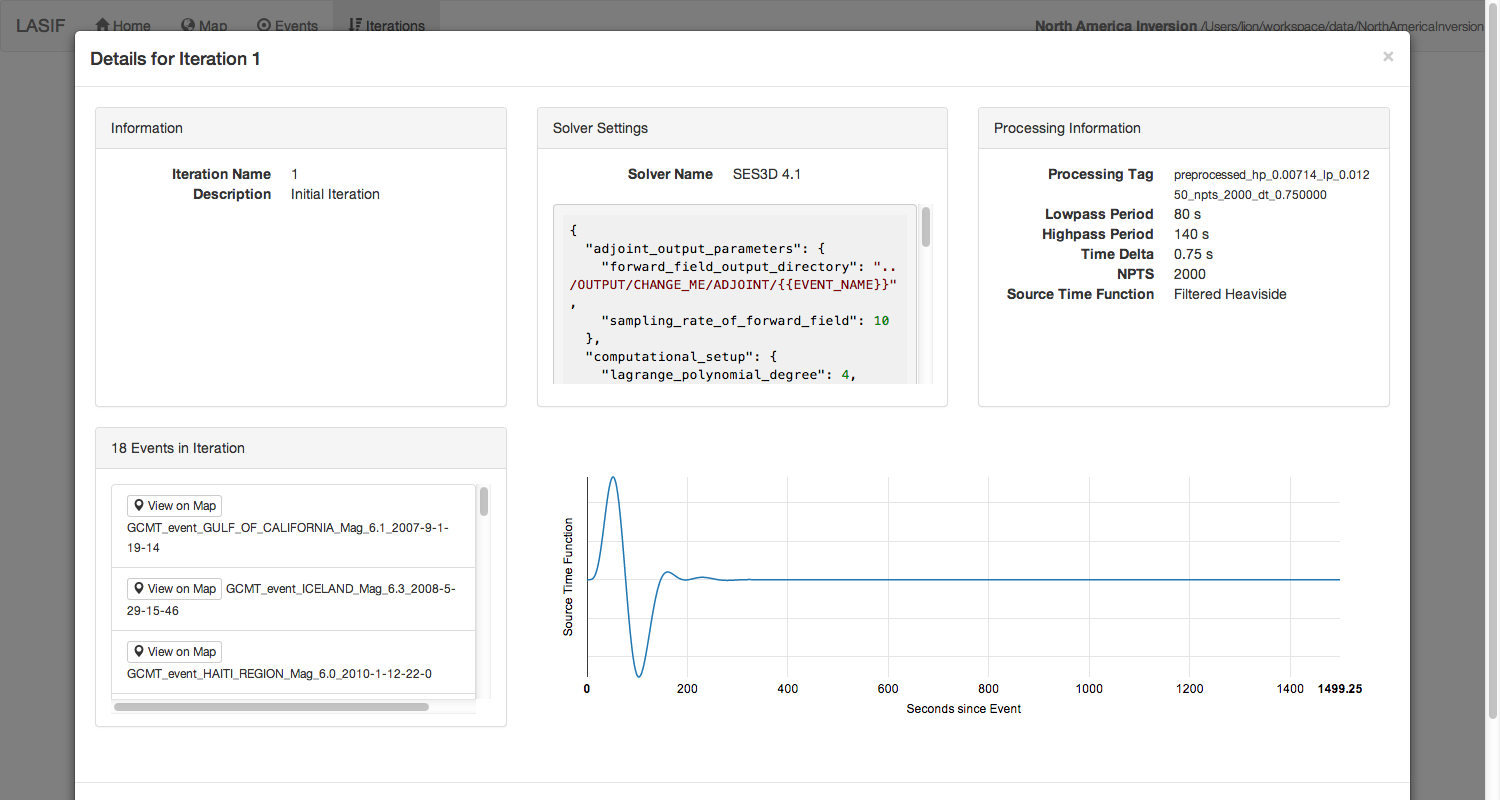
Detailed information about the defined iterations.