LLNL Database Client
You need the actual database to use it. It can be requested from IRIS on this website: https://ds.iris.edu/mda/18-001
Installation
Assuming you use conda, run (in the correct conda environment):
$ conda install -c conda-forge obspy pandas basemap pytest
Now grab this repository with git, and install it with pip. Make sure to
use the -e flag for an editable installation.
$ git clone https://github.com/krischer/llnl_db_client.git
$ cd llnl_db_client
$ pip install -v -e .
If you ever want to update the installation, just run
$ git pull
$ pip install -v -e .
within the repository.
Running the Tests
This is currently only a regression test suite but it checks some things and
has 100% test coverage so at least the Python is correct. You need the
database to run the tests. cd to the llnl_db_client directory and run
$ LLNL_DB_PATH=/path/to/UCRL-MI-222502/westernus.wfdisc py.test
Potential Pitfalls
- Essentially untested!
- This is not a proper CSS reader and should at one point probably replaced by
something more solid, e.g.
obspy.io.cssor something else. - The network code for all traces and the inventory information is always
LLwhich might not play nice with other tools. There appear to be no network codes in the database so that is the best we can do. - The reponses are a bit tricky, except the RESP files which are easy. The
others follow this logic (this might very well be wrong!!!):
- SACPZ files:
- The client currently assumes they correct to displacement in 10E-6 meters! The only justification I have is that this puts the amplitudes in the same ballpark as those corrected for with evalresp.
- Funky PAZ files:
- The client currently assumes they correct to displacement in 10E5 meters! The only justification I have is that this puts the amplitudes in the same ballpark as those corrected for with evalresp.
- SACPZ files:
- Aside from these “empirical corrections” some stations might require additional corrections in the form of polarity flips or amplitude corrections. Please see this academic collection for some choices and their reasoning (https://scholarworks.alaska.edu/handle/11122/8007).
Usage
First initialize a client:
from llnl_db_client import LLNLDBClient

c = LLNLDBClient("./UCRL-MI-222502/westernus.wfdisc")
Print some basic information:
>>> print(c)
LLNL Database 'westernus' (/Users/lion/temp/LLNL_Alaska/LLNL/UCRL-MI-222502)
	11176 waveform files
	147 stations
Get a list of all events with:
>>> c.list_events()
[592897, 2021892, ...]
Get an ObsPy Stream object with all waveforms for an event:
>>> st = c.get_waveforms_for_event(592897)
>>> print(st)
44 Trace(s) in Stream:

.ELK..BBE | 1988-10-13T13:58:01.143010Z - 1988-10-13T14:07:01.118010Z | 40.0 Hz, 21600 samples
...
(42 other traces)
...
.NEL..SHZ | 1988-10-13T13:59:31.660000Z - 1988-10-13T14:05:02.640000Z | 50.0 Hz, 16550 samples

[Use "print(Stream.__str__(extended=True))" to print all Traces]
Instrument correction.
# Has to be done manually!
>>> st.detrend("linear")
>>> st.taper(max_percentage=0.05, type="hann")

# Water level, output, and pre_filt are the same as in Trace.remove_response()
>>> c.remove_response(st, water_level=10, output="VEL", pre_filt=None)
Catalog and inventory objects
# Get a single event objects.
>>> c.get_obspy_event(592897)
Event:	1988-10-13T14:00:00.080000Z | +37.089, -116.050 | 5.9 Mb

	         resource_id: ResourceIdentifier(id="smi:local/...")
	 preferred_origin_id: ResourceIdentifier(id="smi:local/...")
	                ---------
	  event_descriptions: 1 Elements
	               picks: 24 Elements
	             origins: 4 Elements
	          magnitudes: 6 Elements


# Get all events.
>>> c.get_catalog()
153 Event(s) in Catalog:
1988-10-13T14:00:00.080000Z | +37.089, -116.050 | 5.9 Mb
1999-03-24T21:07:33.430000Z | +36.399, -110.481 | 2.7 ML
...
1999-03-10T20:41:13.200000Z | +36.391, -110.326 | 3.1 ML
1999-08-02T05:40:26.580000Z | +37.381, -117.081 | 4.1 ML
To see all events call 'print(CatalogObject.__str__(print_all=True))'

# Get the full inventory
>>> c.get_inventory()
Inventory created at 2018-03-29T13:50:32.420334Z
	Created by: ObsPy 1.1.0
		    https://www.obspy.org
	Sending institution:
	Contains:
		Networks (1):
			LL
		Stations (147):
		    ...
Helper function to get a list of all unique channels.
>>> c.get_unique_channels()
{('A5CSNV', 'EHE'),
 ('A5CSNV', 'EHN'),
 ('A5CSNV', 'EHZ'),
 ('A5NENV', 'EHE'),
 ...
Plots
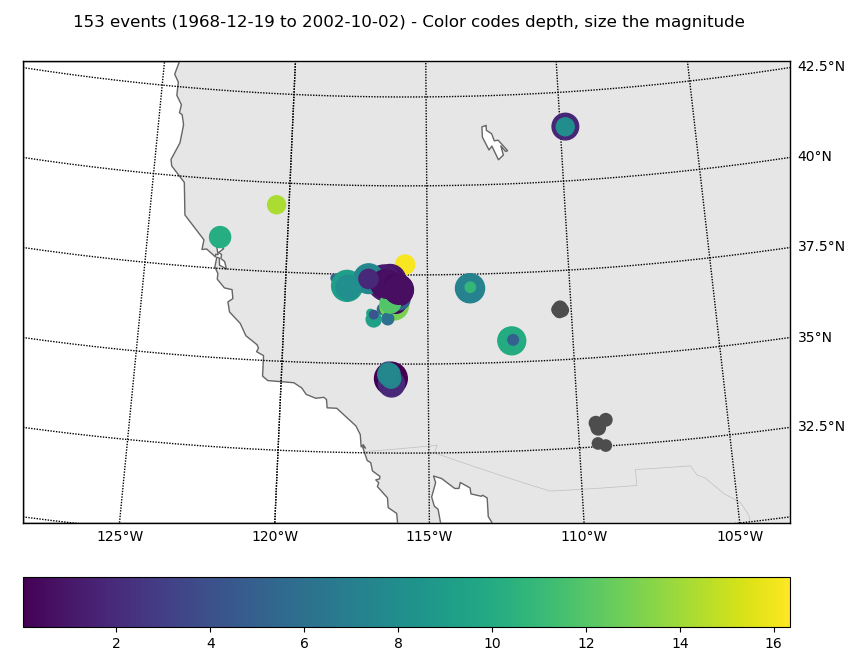
Plot a map of the database:
>>> c.plot()
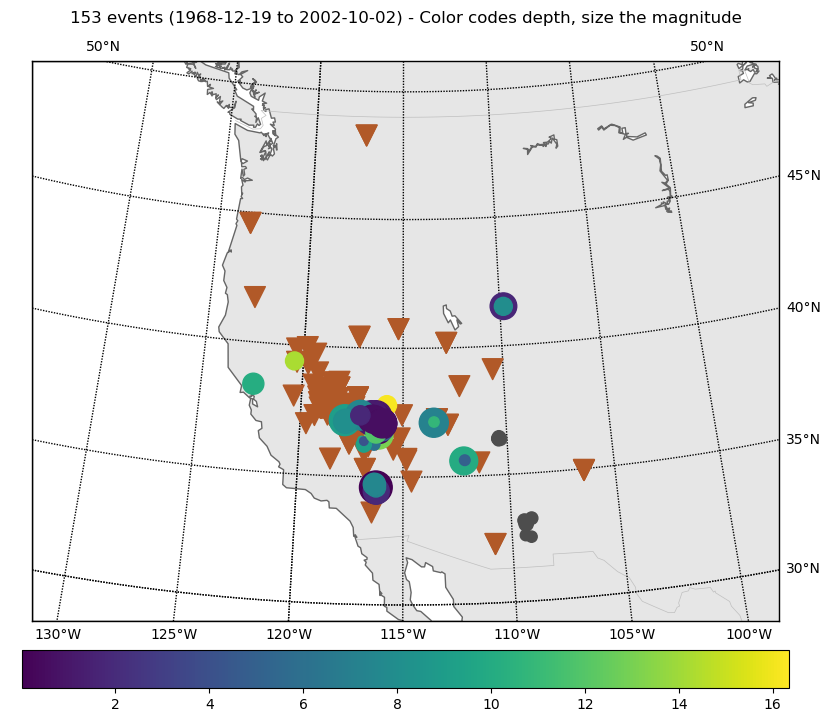
Same for only the events:
>>> c.plot_events()
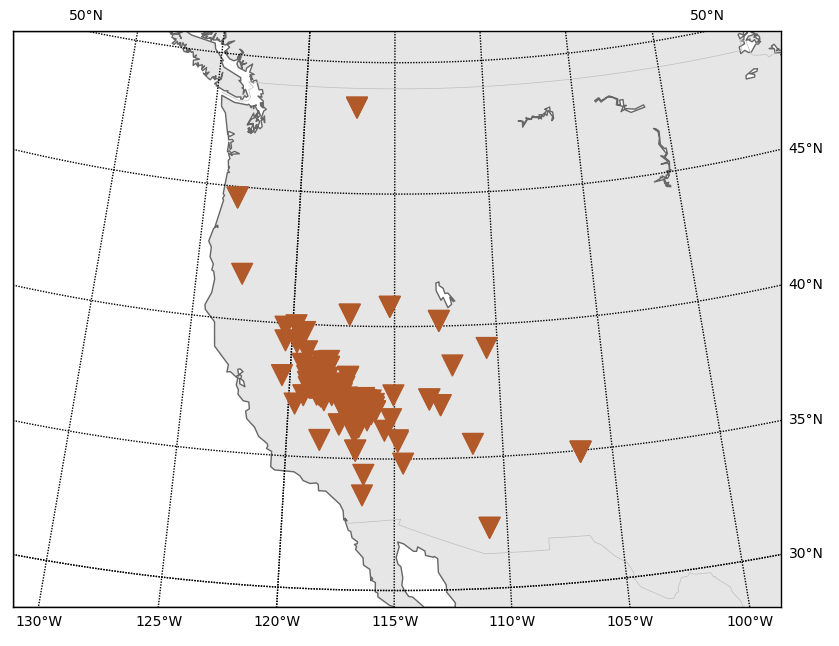
And for only the stations:
>>> c.plot_stations()